Web Dashboard
The web dashboard is a Next.js + MUI application that talks to the apiserver’s REST API. It provides a visual way to monitor agents, manage agent groups and remote configuration, and administer namespaces, users, and RBAC.
Running it
cd web
npm install
OPAMP_API_URL=http://localhost:8080 npm run dev
Open http://localhost:3000. The browser never calls the apiserver directly — a
Next.js route handler proxies requests server-side and attaches the session
credential. See web/README.md
for environment variables and the production build.
Sign in
Sign in with basic auth or GitHub OAuth, depending on how the server is configured.
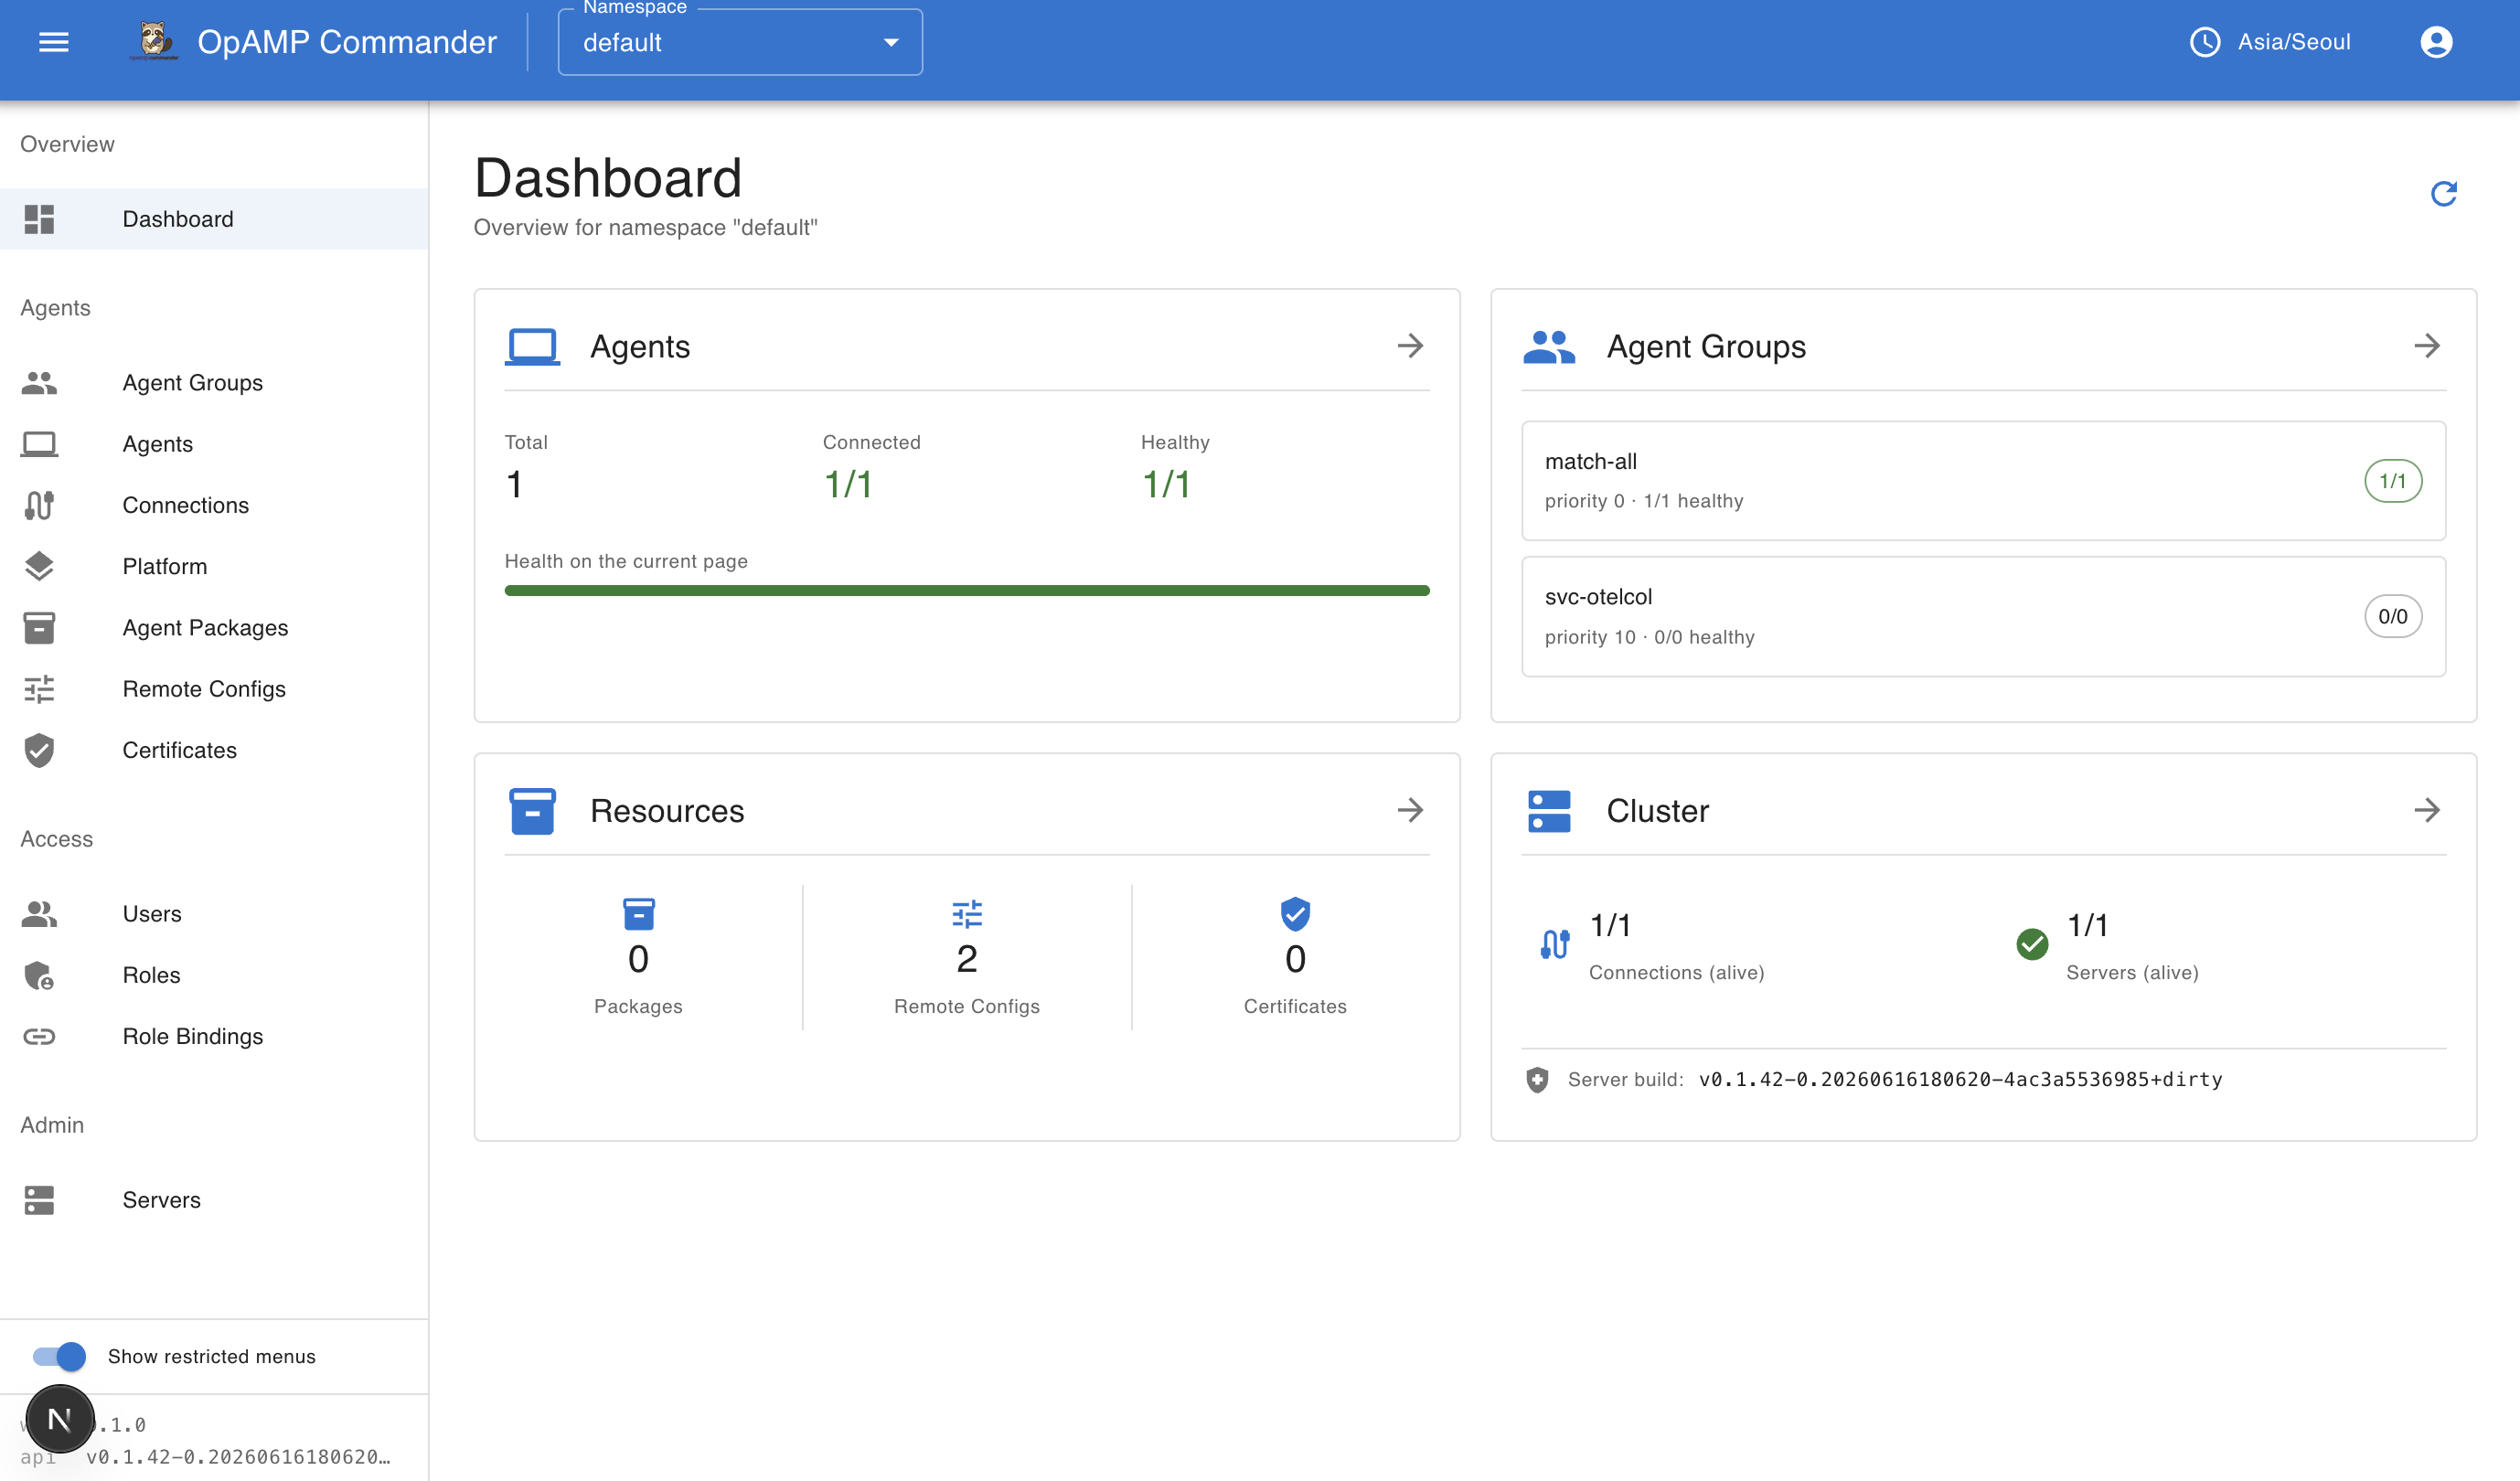
Dashboard
The dashboard summarizes the selected namespace: agent counts and health, agent groups, resource counts (packages, remote configs, certificates), and cluster status. Use the namespace selector in the top bar to switch namespaces.
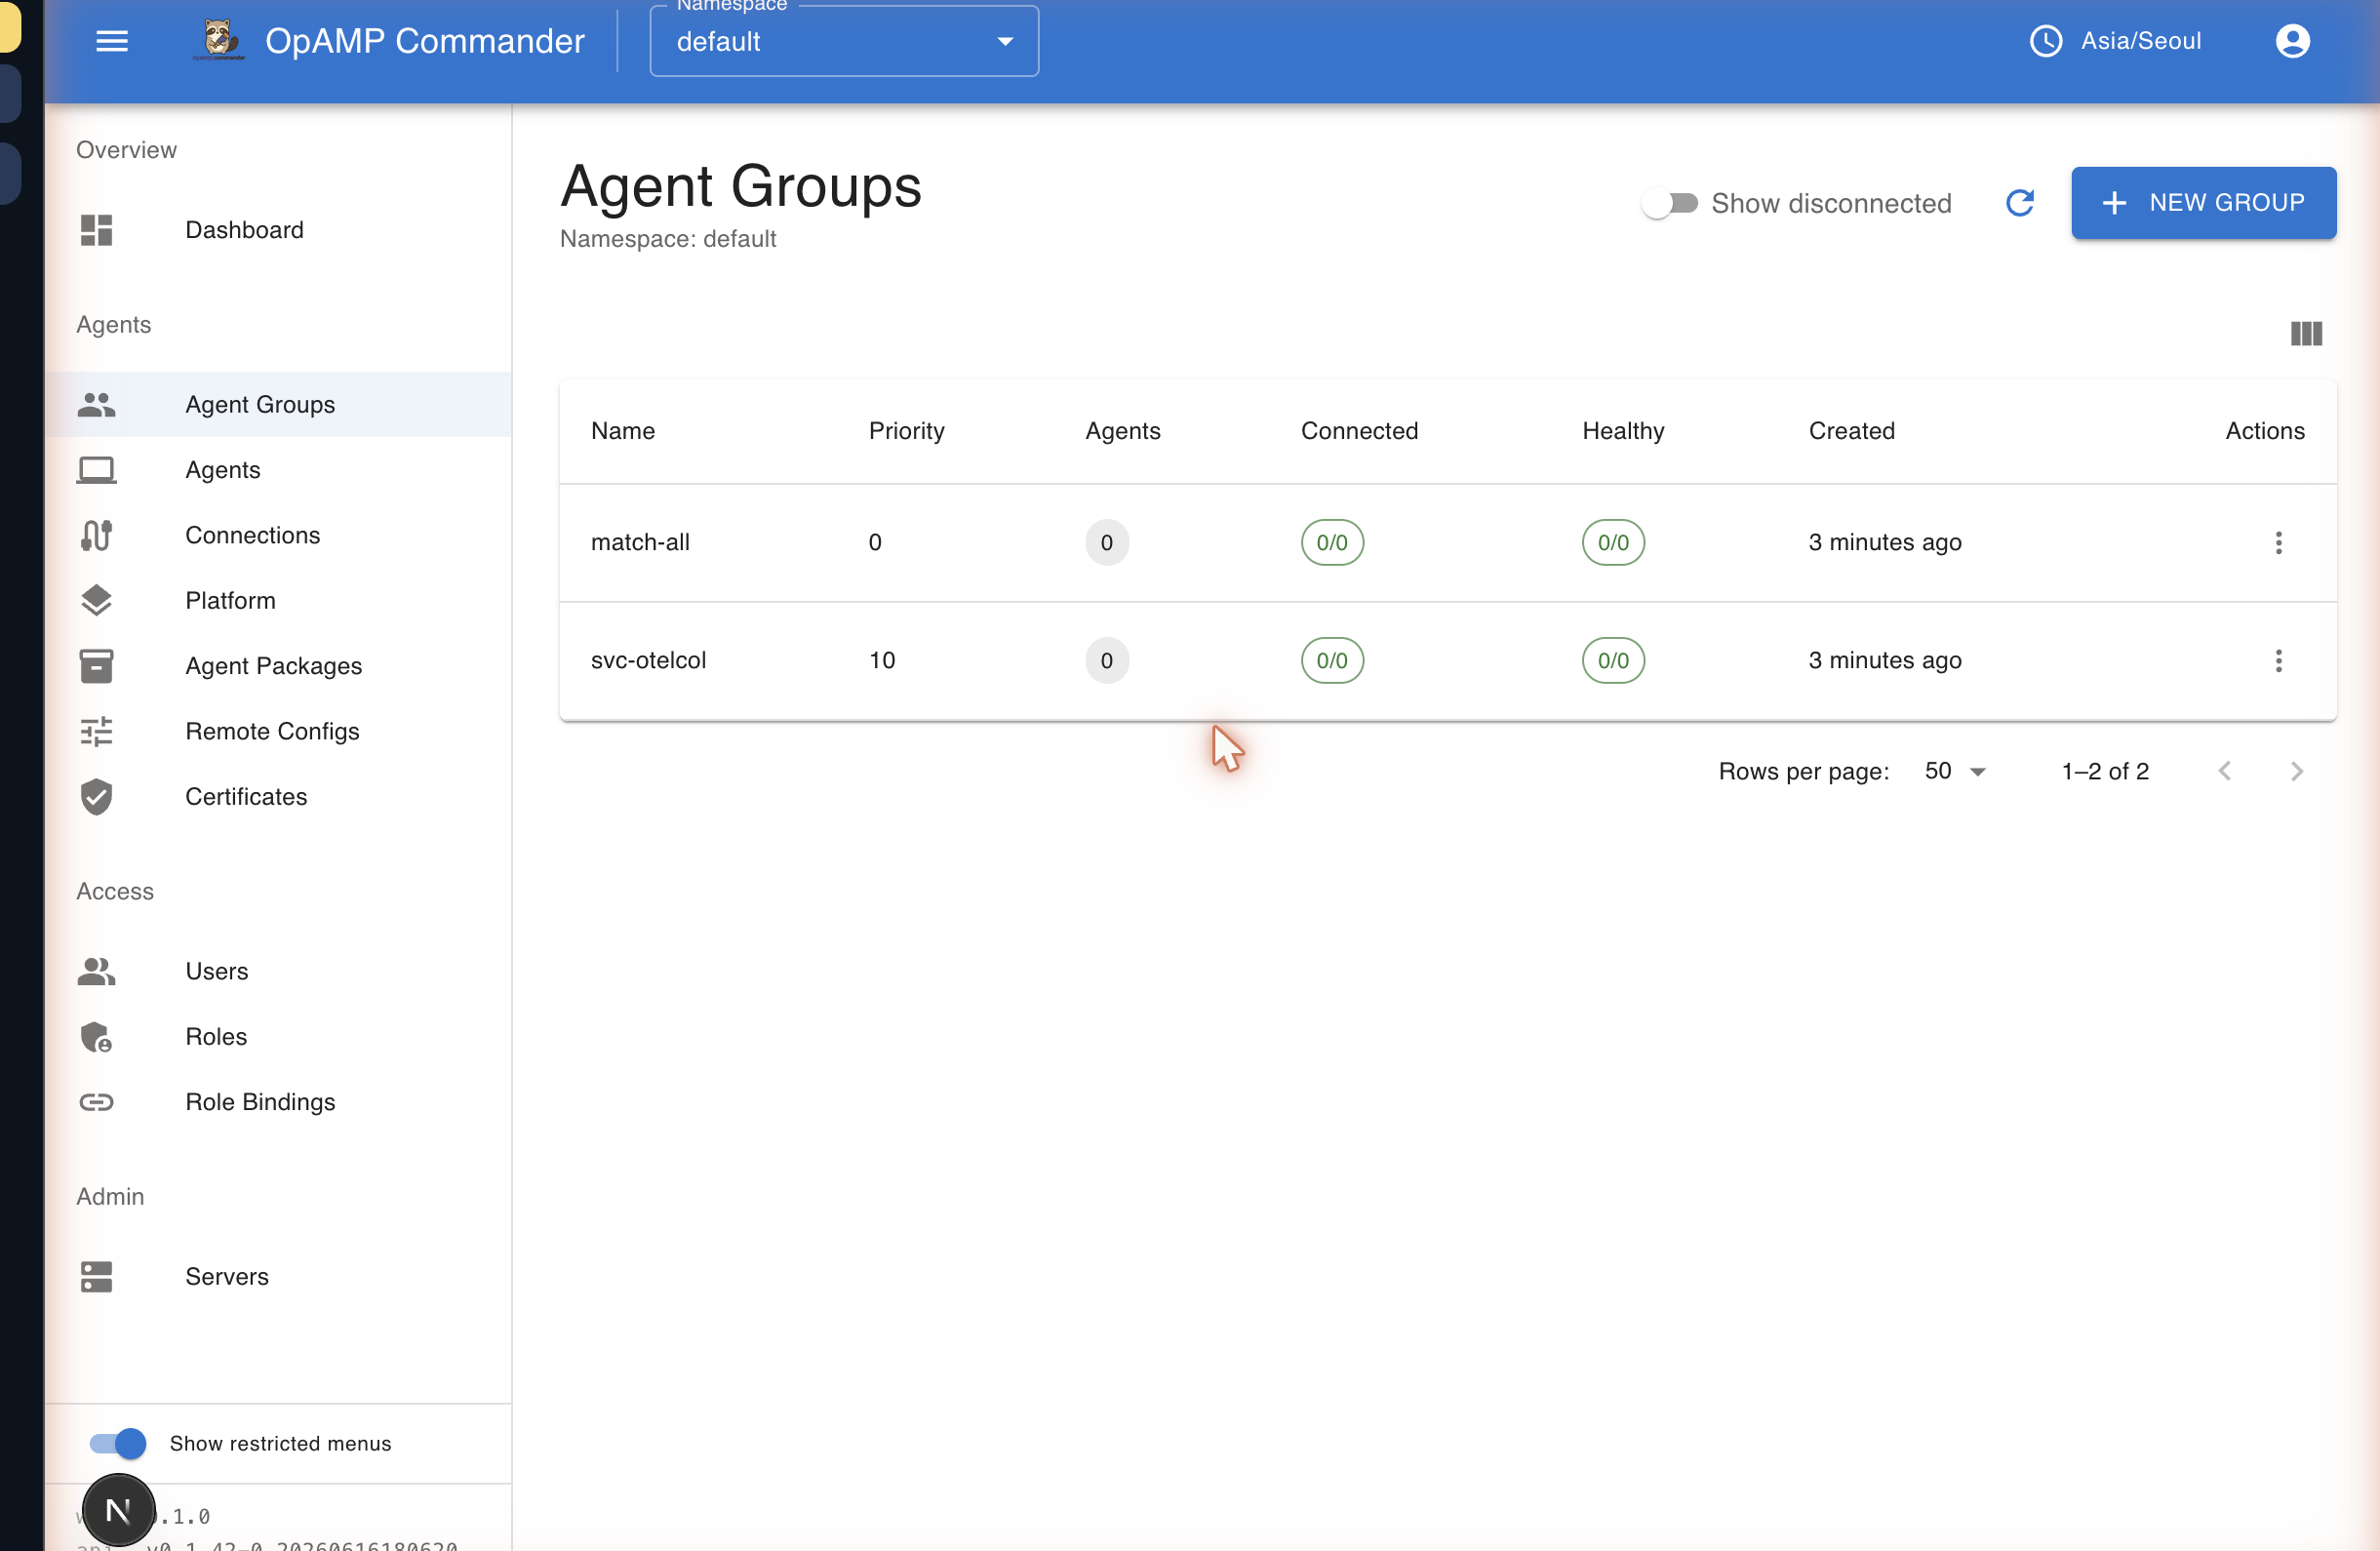
Agent groups
Agent groups apply shared configuration to agents matched by a selector. The list shows each group’s priority and how many agents are connected and healthy.
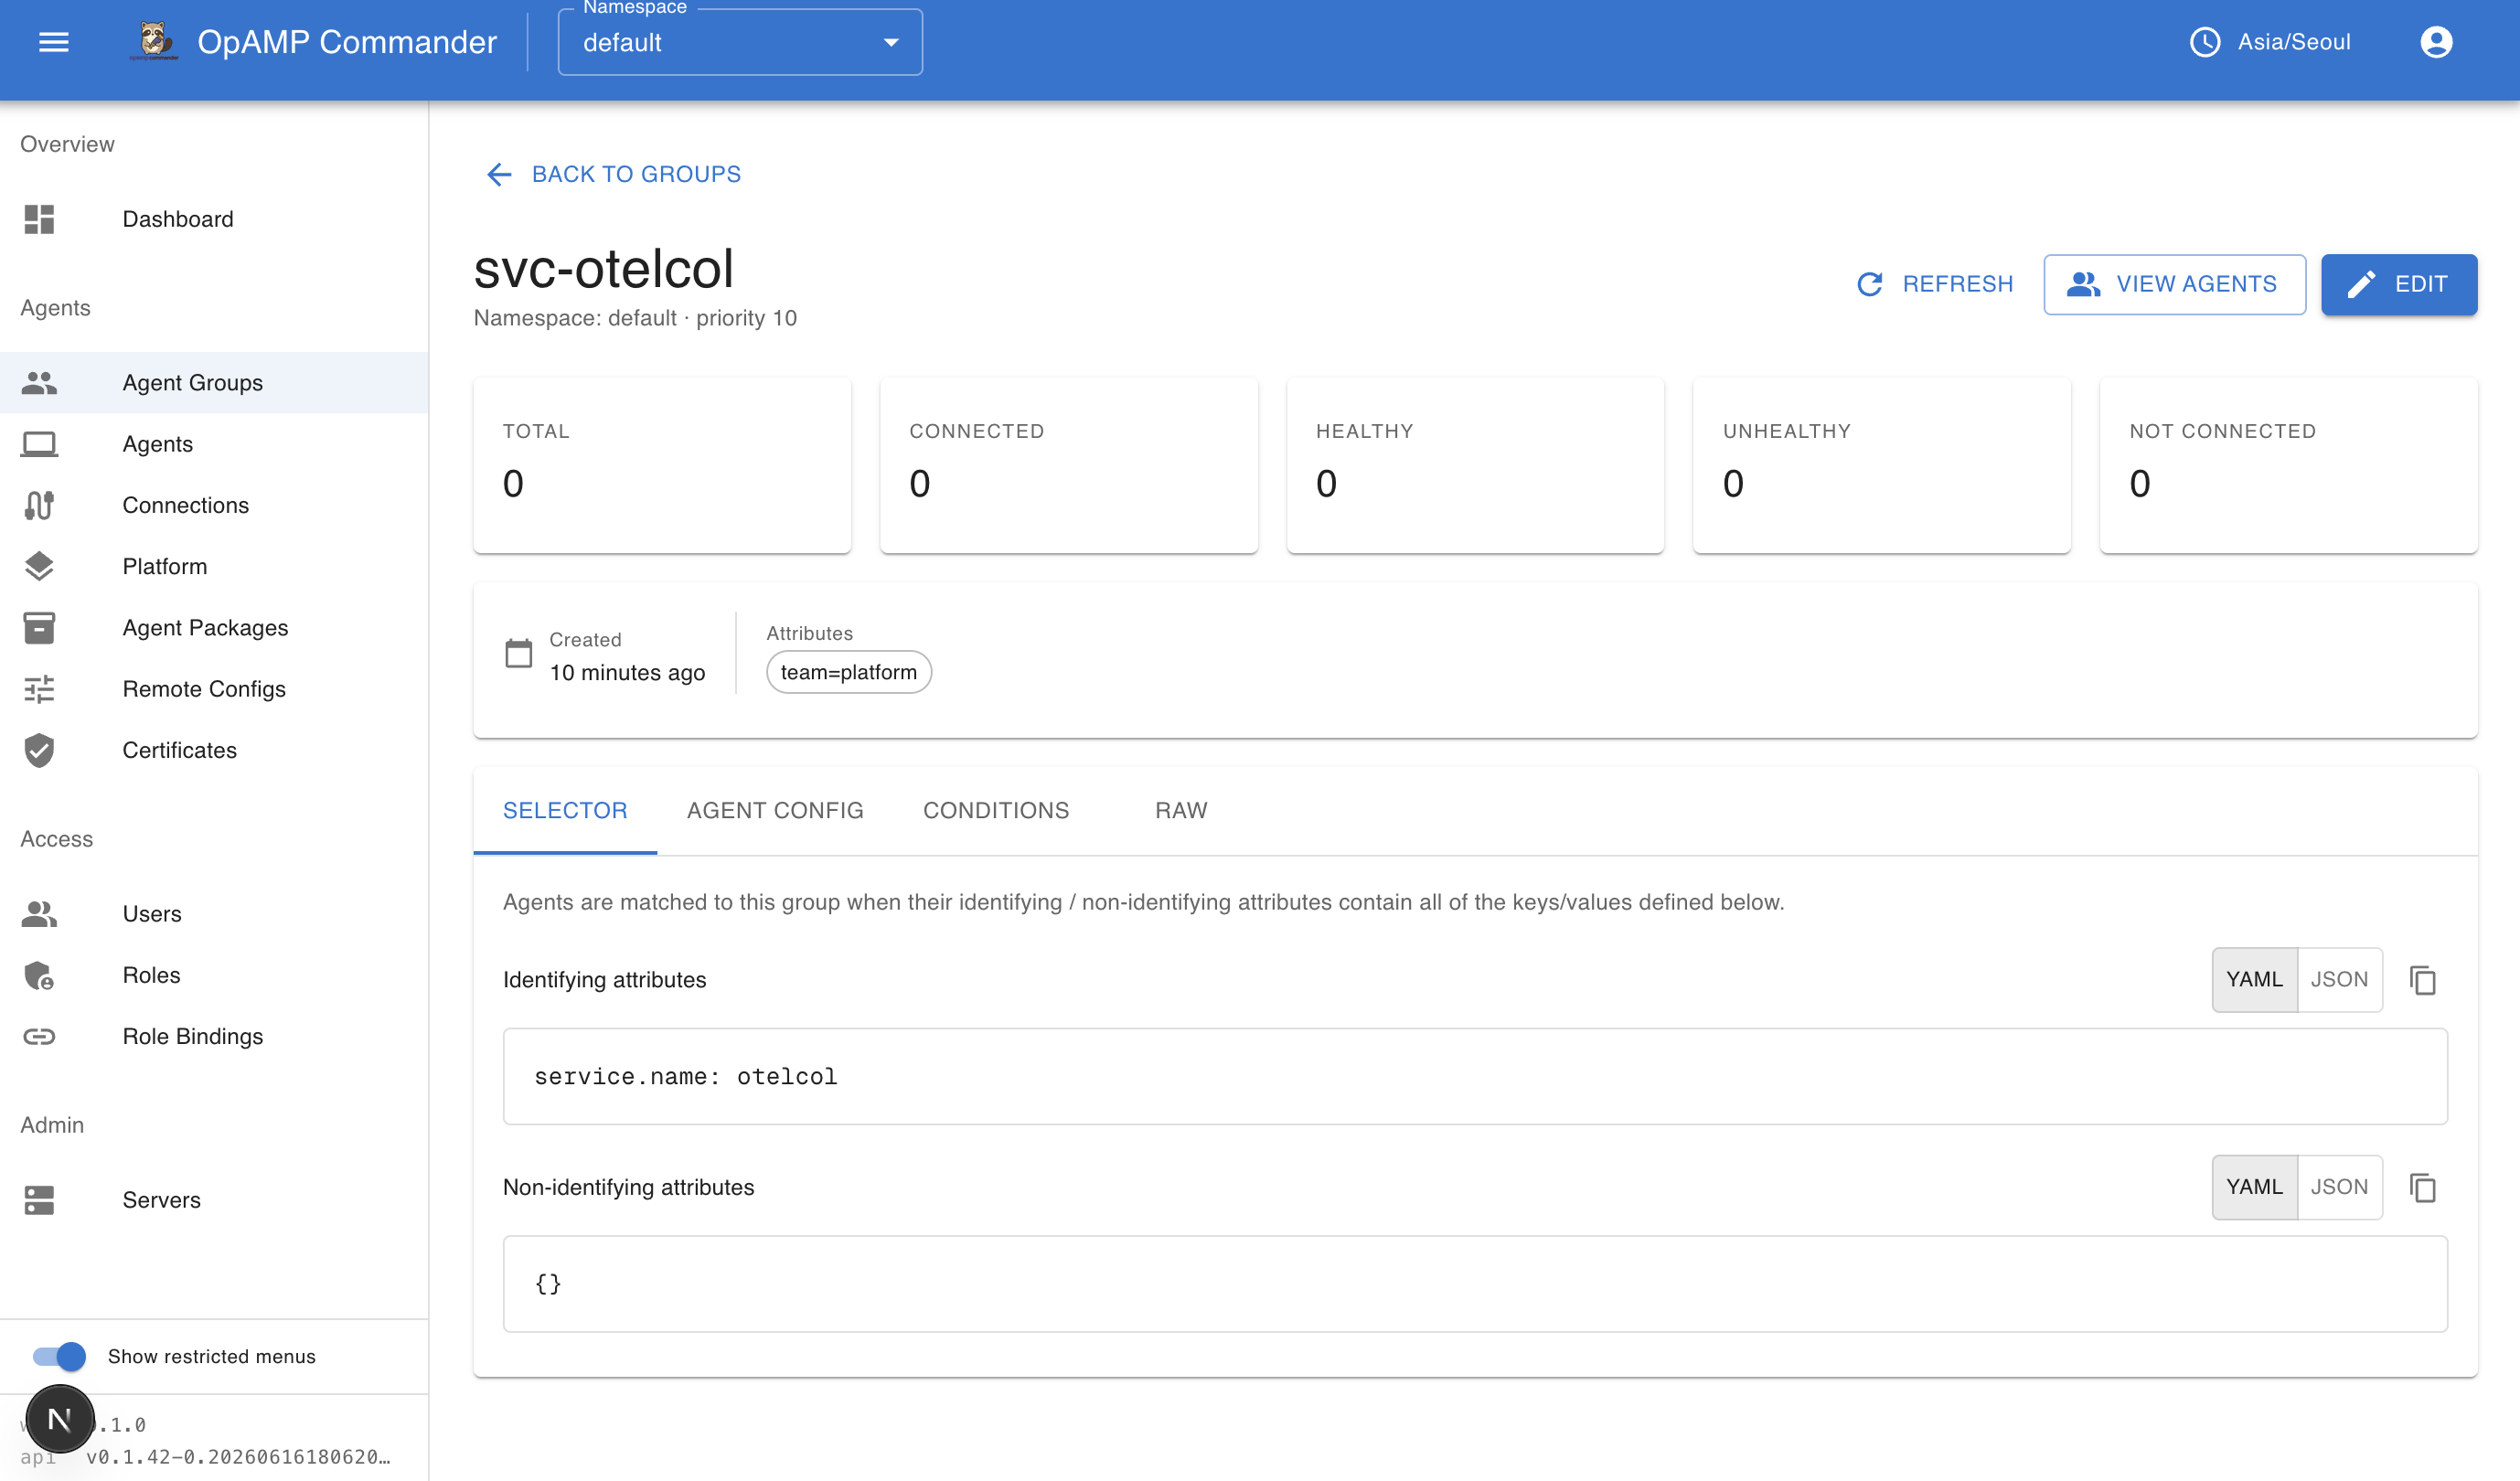
A group’s detail page shows its selector, the remote configuration it applies, status conditions, and the raw resource.
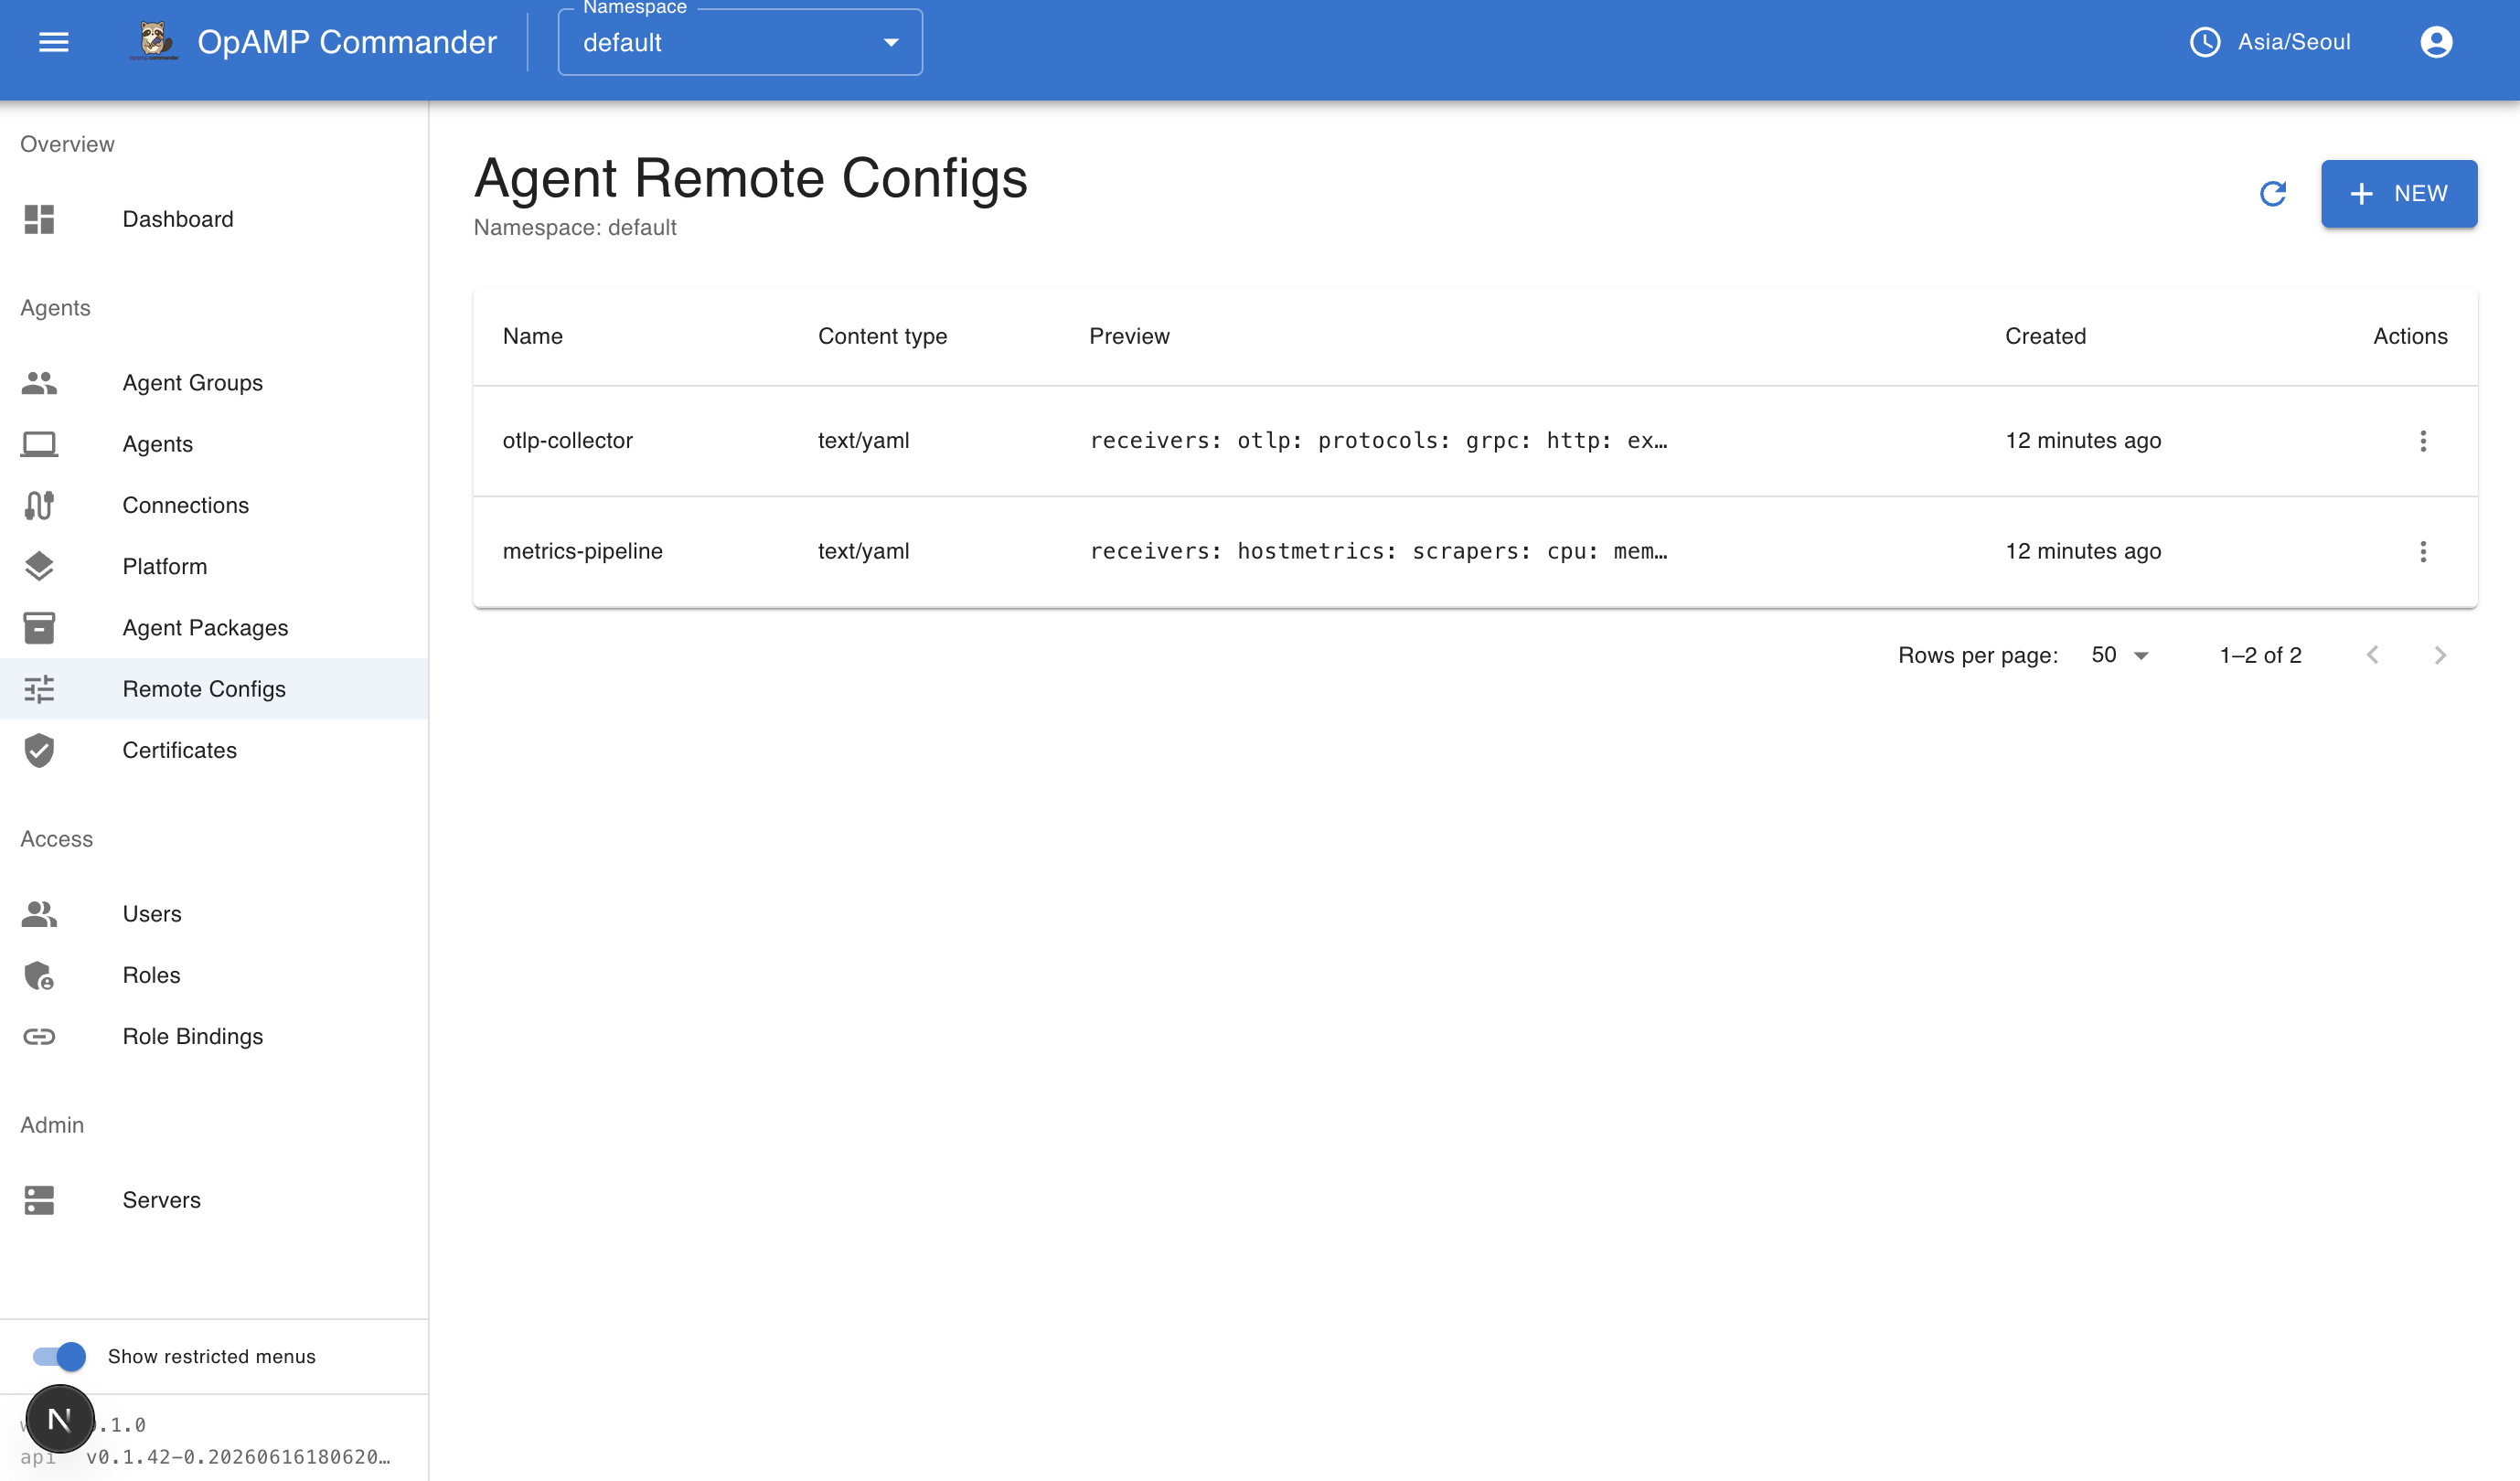
Remote configs
Remote configs hold reusable agent configuration payloads that groups can reference.
Agents
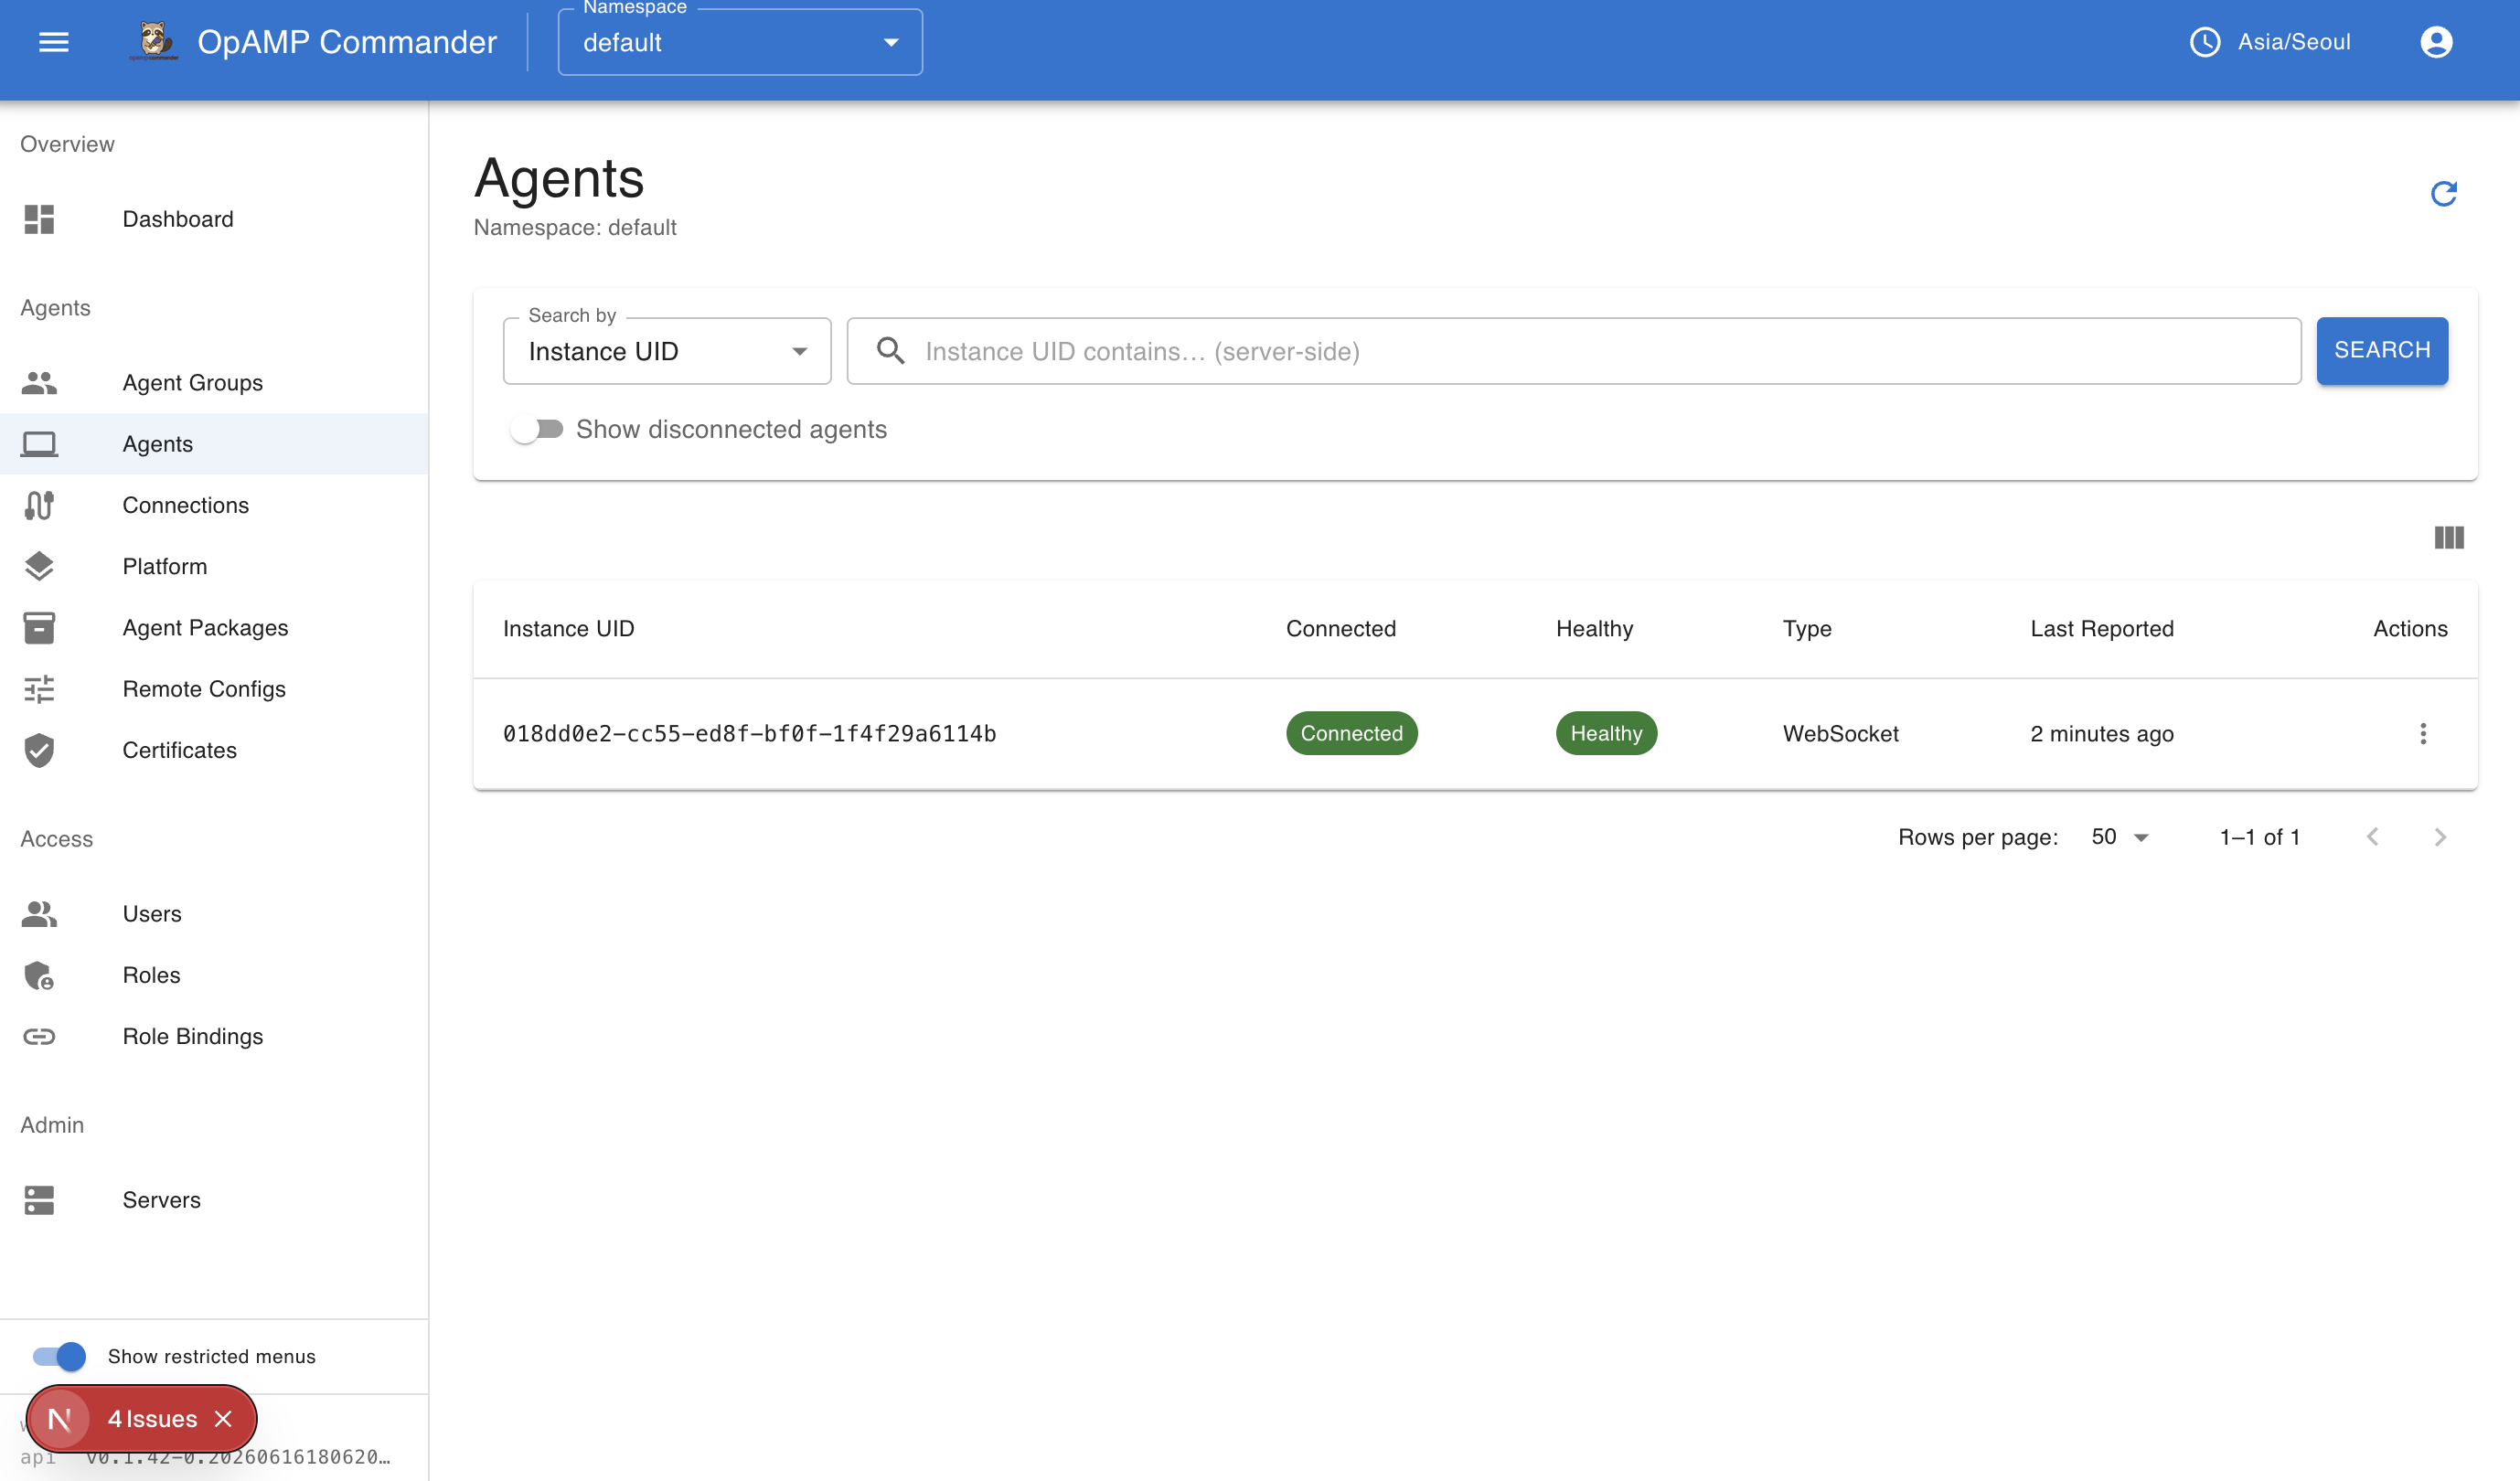
The Agents page lists the collectors connected to the server with their connection
type and reported health. Agents appear here once an OpAMP-capable collector connects
to the server’s /api/v1/opamp endpoint — see
Getting Started.
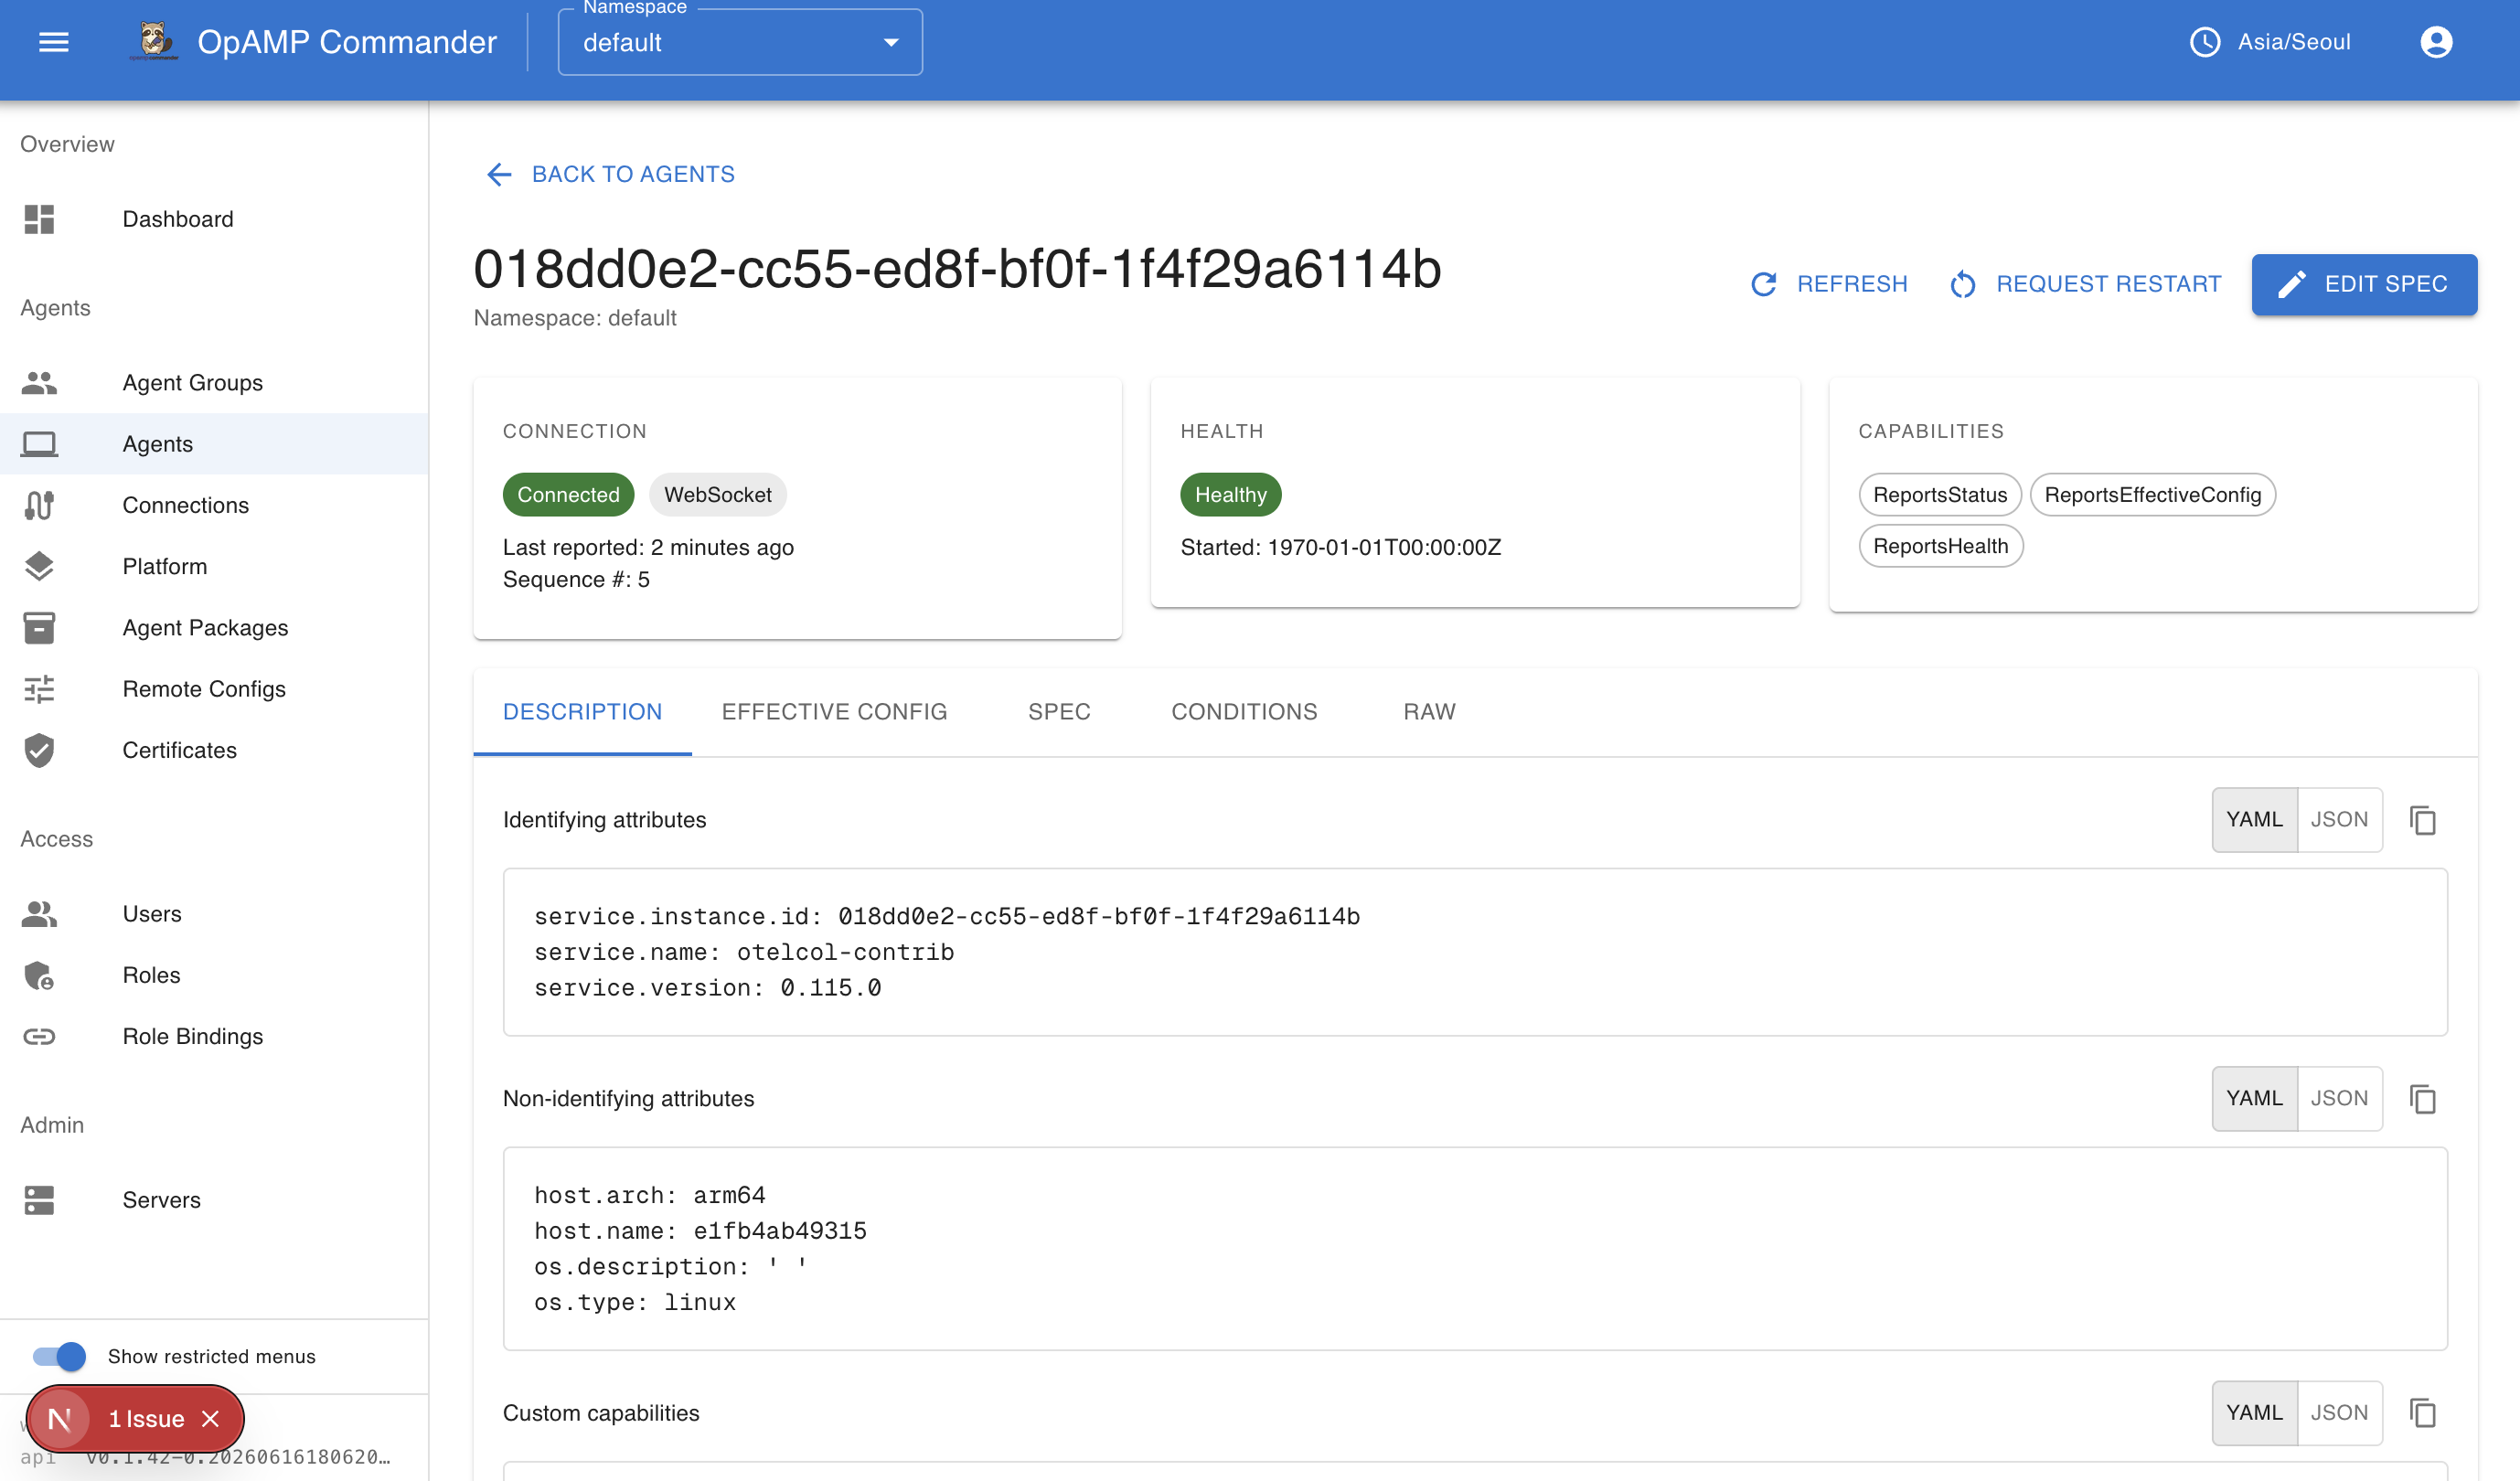
Each agent’s detail page shows its connection and health status, capabilities, identifying and non-identifying attributes, effective config, and the raw resource.
Connections
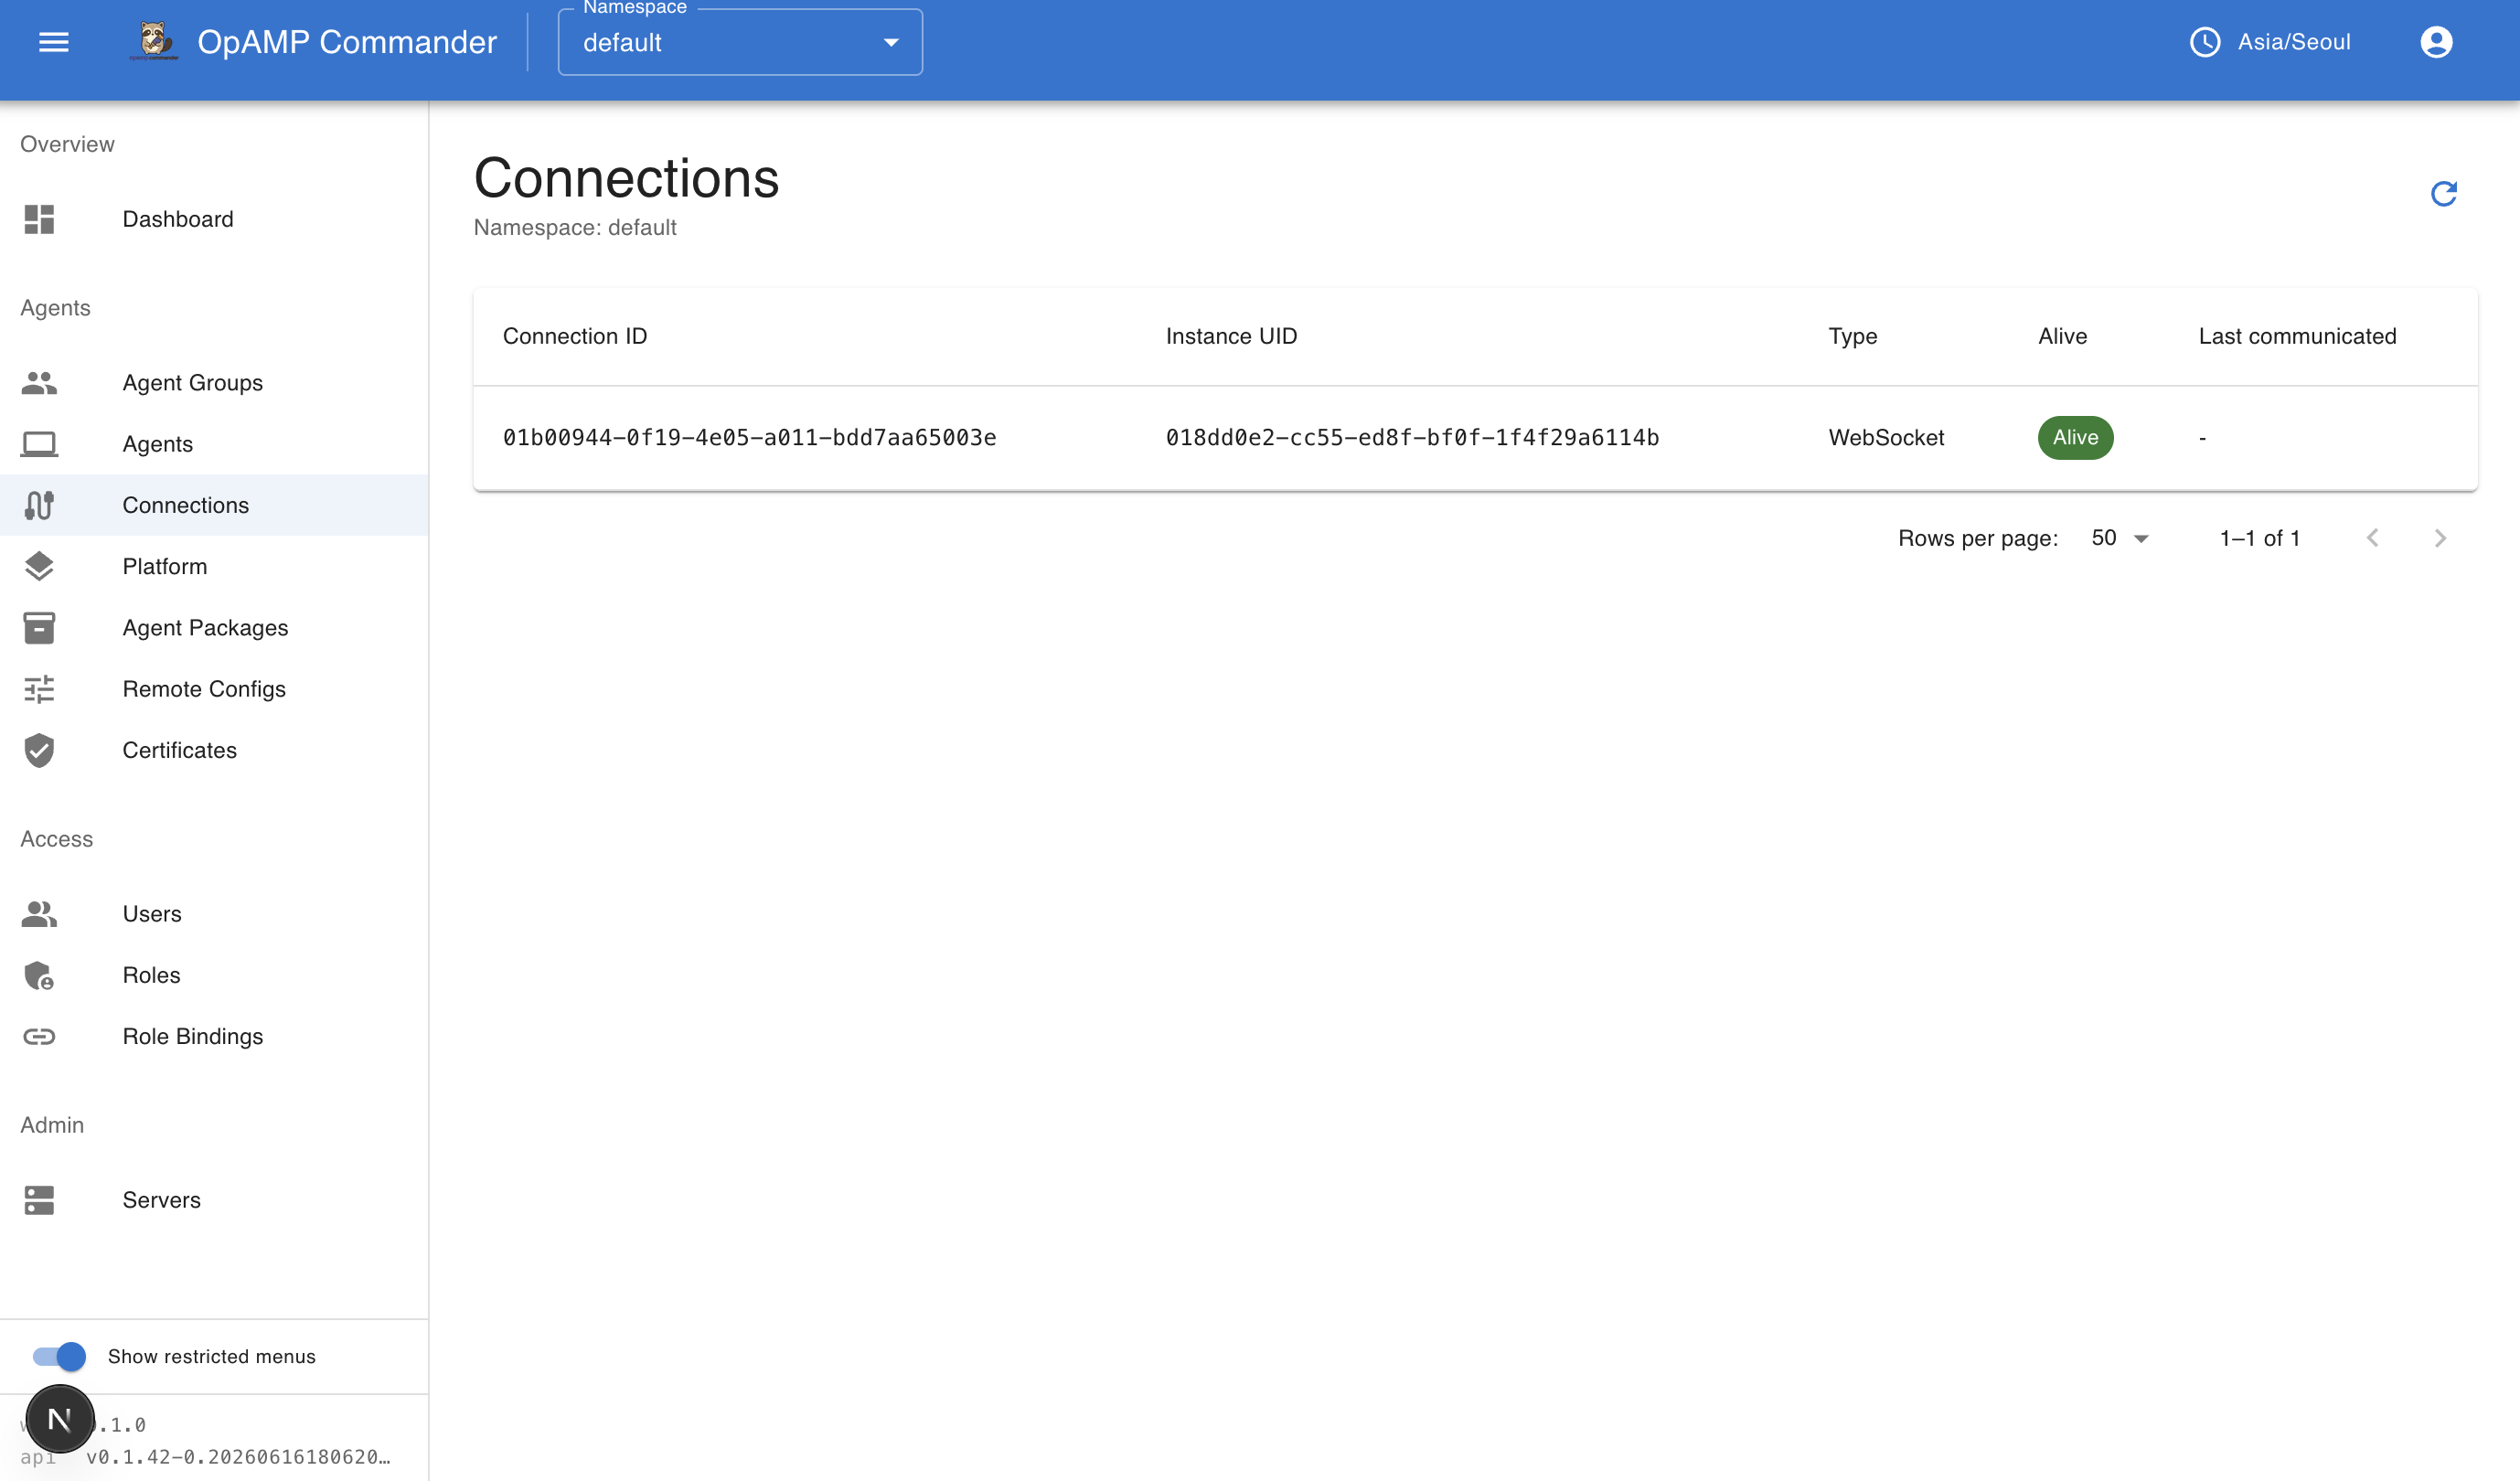
The Connections page shows the live WebSocket (or HTTP) connections currently held by the server, including which instance each connection belongs to and whether it is alive.
Feedback
Was this page helpful?